2015年AP物理2简答题真题+答案+PDF下载
Directions: Questions 1 and 4 are short free-response questions that require about 20 minutes each to answer and are worth 10 points each. Questions 2 and 3 are long free-response questions that require about 25 minutes each to answer and are worth 12 points each. Show your work for each part in the space provided after that part.

1. (10 points - suggested time 20 minutes)
The figure above shows a cross section of a drinking glass (index of refraction 1.52) filled with a thin layer of liquid (index of refraction 1.33). The bottom corners of the glass are circular arcs, with the bottom right arc centered at point O. A monochromatic light source placed to the right of point P shines a beam aimed at point O at an angle of incidence θ. The flat bottom surface of the glass containing point P is frosted so that bright spots appear where light from the beam strikes the bottom surface and does not reflect. When θ=θ1, two bright spots appear on the bottom surface of the glass. The spot closer to point P will be referred to as X; the spot farther from P will be referred to as Y. The location of spot X and that of spot Y both change as θ is increased.
(a) In a coherent paragraph-length answer, describe the processes involved in the formation of spots X and Y when θ=θ1. Include an explanation of why spot Y is located farther from point P than spot X is and what factors affect the brightness of the spots.
(b) When θ is increased to θ2, one of the spots becomes brighter than it was before, due to total internal reflection.
- i. On the figure below, draw a ray diagram that clearly and accurately shows the formation of spots X and Y when θ=θ2.

- ii. Which spot,X or Y, becomes brighter than it was before due to total internal reflection? Explain your reasoning.
(c) When θ is further increased to θ3, one of the spots disappears entirely.
- i. On the figure below, draw a ray diagram that clearly and accurately shows the formation of the remaining spot, X or Y, when θ=θ3。

2.(12 points, suggested time 25 minutes)
A battery of emf ε and negligible internal resistance, three identical incandescent lightbulbs, and a switch S that is initially open are connected in the circuit shown above. The bulbs each have resistance R. Students makepredictions about what happens to the brightness of the bulbs after the switch is closed.
(a) A student makes the following prediction about bulb 1: “Bulb 1 will decrease in brightness when the switch is closed.”
- i.Do you agree or disagree with the student’s prediction about bulb 1 ? Qualitatively explain yourreasoning.

- ii.Before the switch is closed, the power expended by bulb 1 is P1. Derive an expression for the power Pnew expended by bulb 1 after the switch is closed in terms of P1
- iii. How does the result of your derivation in part (a)ii relate to your explanation in part (a)i?
(b) A student makes the following prediction about bulb 2: “Bulb 2 will decrease in brightness after the switch is closed.”
- i.Do you agree or disagree with the student’s prediction about bulb 2 ? Explain your reasoning in words.
- ii.Justify your explanation with a calculation.
(c) While the switch is open, bulb 3 is replaced with an uncharged capacitor. The switch is then closed.
- i.How does the brightness of bulb 1 compare to the brightness of bulb 2 immediately after the switchis closed? Justify your answer.
- ii.How does the brightness of bulb 1 compare to the brightness of bulb 2 a long time after the switchis closed? Justify your answer.
3. (12 points, suggested time 25 minutes)
Students are watching a science program about the North Pole. The narrator says that cold air sinking near the North Pole causes high air pressure. Based on the narrator’s statement, a student makes the following claim: “Since cold air near the North Pole is at high pressure, temperature and pressure must be inversely related.”
(a) Do you agree or disagree with the student’s claim about the relationship between pressure and temperature? Justify your answer.
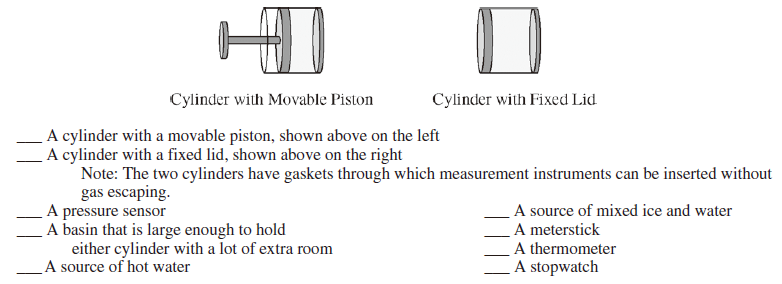
After hearing the student’s hypothesis, you want to design an experiment to investigate the relationship between temperature and pressure for a fixed amount of gas. The following equipment is available.

(b) Put a check in the blank next to each of the items above that you would need for your investigation. Outline the experimental procedure you would use to gather the necessary data. Make sure the outline contains sufficient detail so that another student could follow your procedure.
The table below shows data from a different experiment in which the volume, temperature, and pressure of a sample of gas are varied.

(c) What subset of the experimental trials would be most useful in creating a graph to determine the relationship between temperature and pressure for a fixed amount of gas? Explain why the trials you selected are most useful.
(d) Plot the subset of data chosen in part (c) on the axes below. Be sure to label the axes appropriately.Draw a curve or line that best represents the relationship between the variables.

(e) What can be concluded from your curve or line about the relationship between temperature and pressure?


你可能还关注